Getting Started with Data Exploration
Overview of the Data Subtab

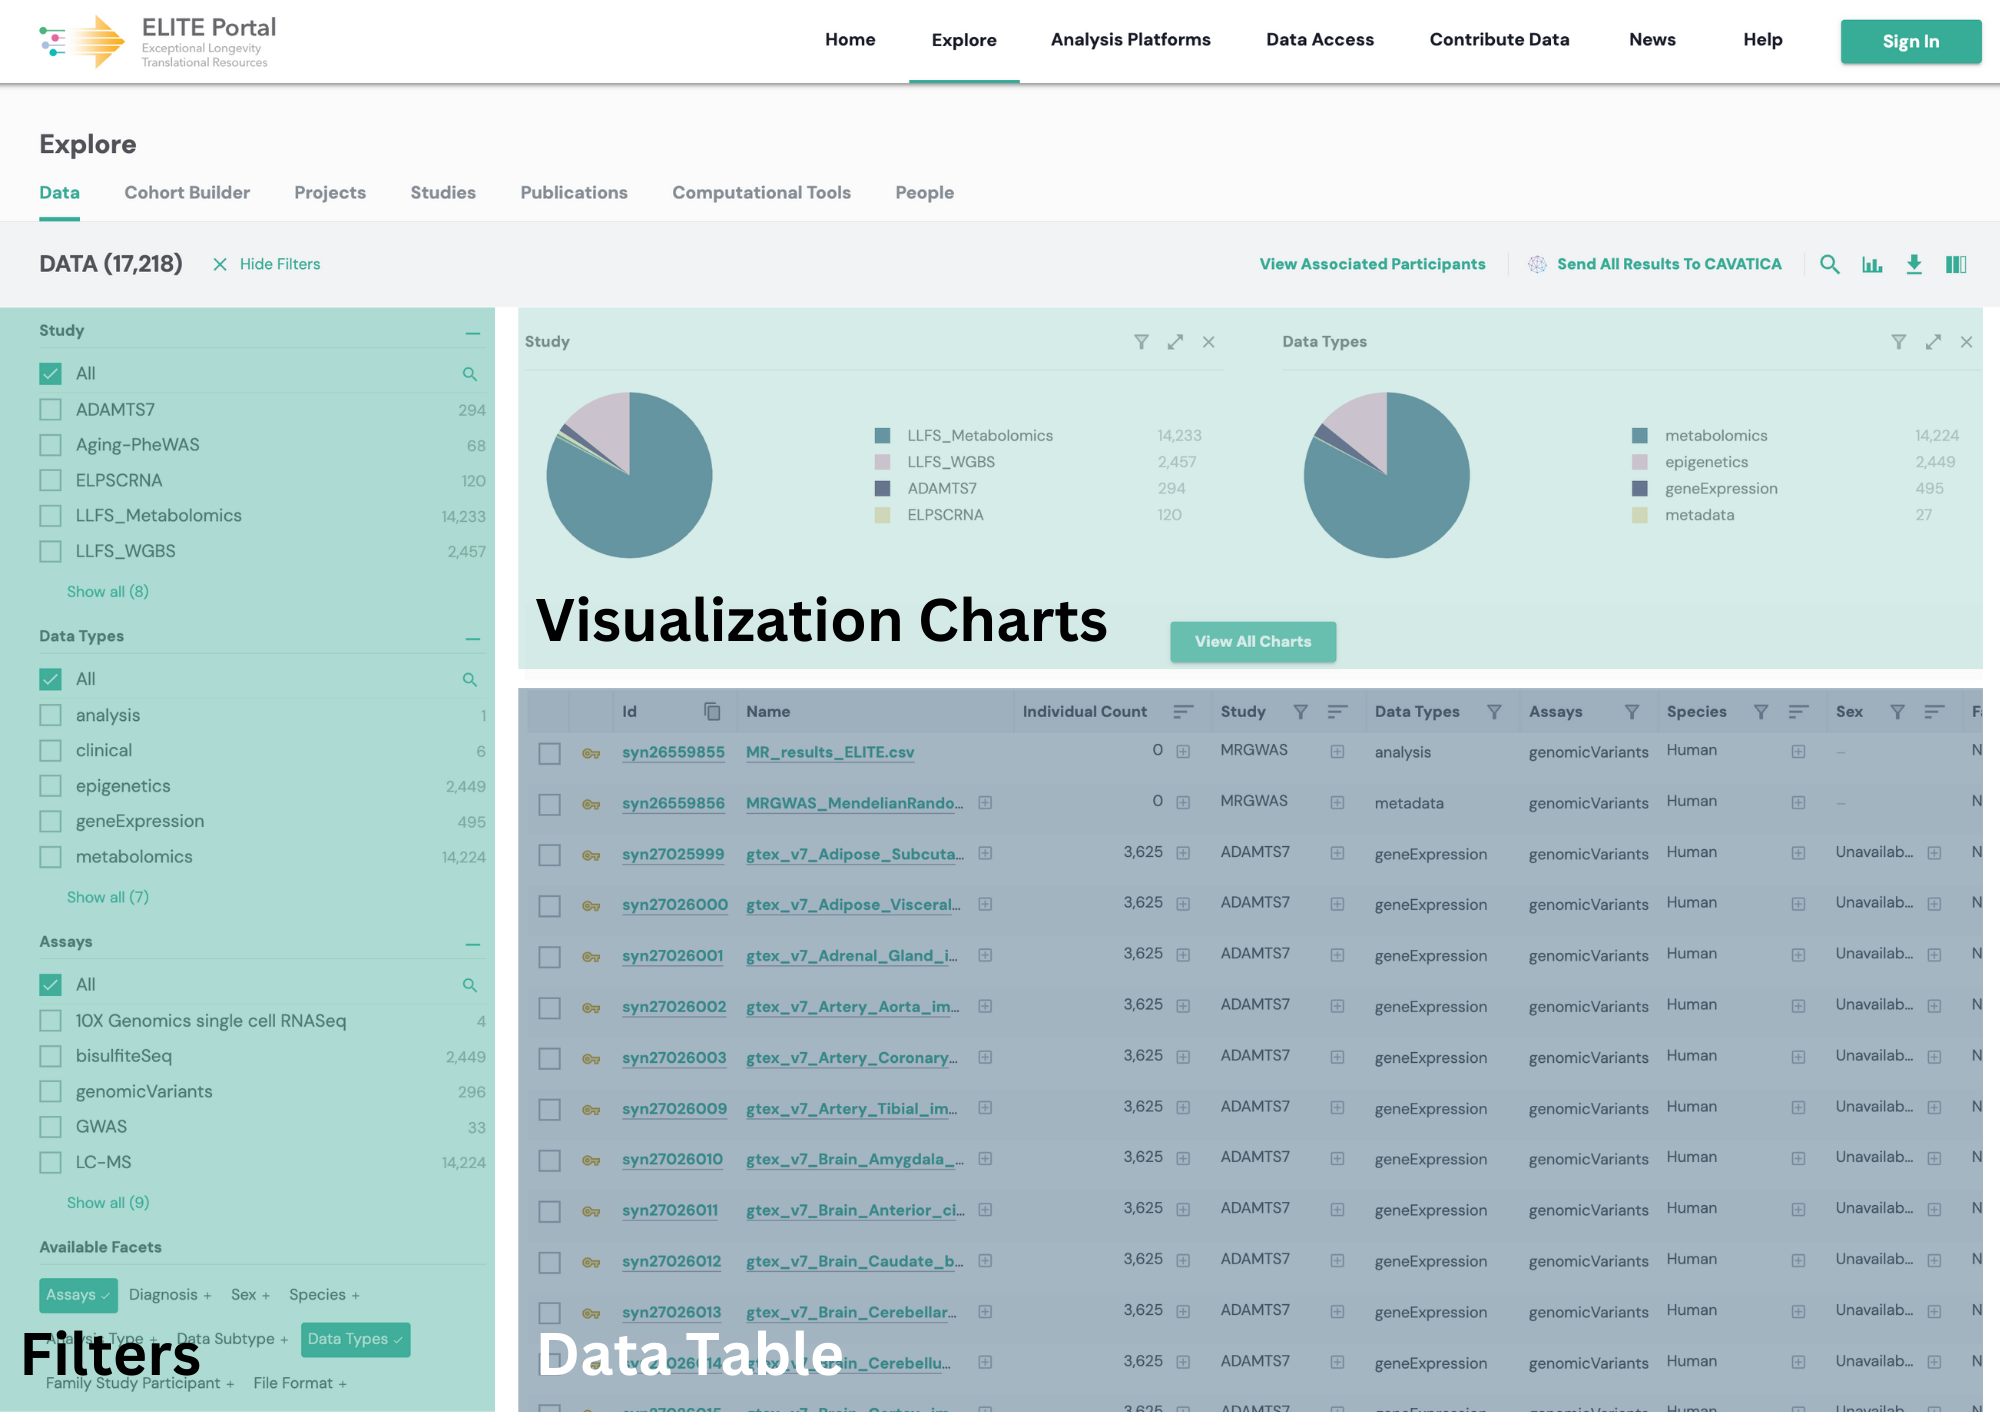
The Explore tab is your gateway to browsing and filtering data on the ELITE Portal. Within the Data subtab, you’ll find a layout divided into three sections:
1. Visualization Charts (top): Provides visual summaries of the dataset.
2. Data Table (bottom): Displays detailed file information.
3. Filters (left): Helps you narrow down data based on specific criteria.
Note: The numbers and data displayed in examples are dynamic and may vary as new data is uploaded to the portal.
1. Using Filters
When you first open the Data subtab, the data table shows all available data files by default. Use the filters on the left to narrow down the results.
How to Use Filters:
-
Filter Categories: By default, you’ll see options like Study, Data Types, and Assays.
-
Expand Options: Click Show All at the bottom of each category to see all filters in that section.
-
Search Filters: Click the magnifying glass icon to search for specific values in each category.
-
Add More Filters: Use the Available Facets section to reveal additional filters like Species, File Format, and Metadata Type by clicking the + icon. Filters already in use are marked with a checkmark.
-
File Counts: Numbers next to filters show how many files match that option.
-
Combine Filters: Select multiple filters to further narrow results.
Managing Filters:
-
Each active filter appears above the Filters section.
-
Remove specific filters by clicking the X next to them, or reset everything by selecting Clear All Filters in the top-right corner.

2. Adjusting Page Settings
At the top right corner of the page, several tools allow you to customize your view:
-
Search Bar: Search for specific terms within set categories.
-
Show/Hide Visualizations: Toggle the visualization charts on or off.
-
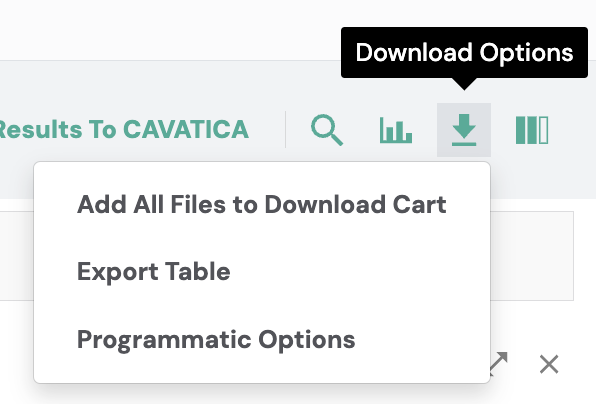
Export Data: Download the data table as a .csv or .tsv file, use the Add to Download Cart feature to save files for download, or view Programmatic Options for downloading data files.
-
Show/Hide Columns: Use the columns icon to hide or show specific fields in the data table.

3. Exploring Visualization Charts
The charts provide an interactive summary of your data.
-
Filter by Charts: Click the filter icon on a chart to apply category-specific filters. This updates the overall data table and functions the same as the filters on the left.
-
Expand/Contract Charts: Click the expand icon to enlarge any chart or contract it to return to normal.
-
Customize Display: Add or remove charts using View All Charts or Hide Charts options.
4. Working with the Data Table
Available data files are displayed in a table format below the charts. Each row represents a single file. Key table features include:
-
View metadata: Use the horizontal scroll bar below the table to view additional metadata categories.
-
Pagination: View 25 rows at a time. View additional rows by navigating with the Next/Previous buttons below the table.
Important Definitions
Each table column contains metadata, or “data about data,” specific to a file.
-
Access Icon:
-
Key Icon: Indicates restricted access. Click to request access.
-
Unlock Icon: Indicates open access or that you have fulfilled access requirements.
-
-
Name: The file’s name.
-
ID (synID): A unique, unchanging identifier for each Synapse entity, formatted as syn12345678. Used to locate and download files.
-
Individual Count: Number of human participants represented in the data.
-
Study: Abbreviation of the associated ELITE Portal study.
Other Definitions
-
Family Study Participant: Indicates if the file contains data on a family study participant.
-
Is Model System: Indicates if the file includes data from an animal model.
-
Is Multi Specimen: Indicates if the file contains data from multiple biospecimens.
5. Downloading Data
There are several options for choosing files to download.
-
Select Files individually: Use checkboxes to pick specific files to download or send to CAVATICA.
-
Select all Files: Download or send to CAVATICA all files included in the current data table.
To download your selected files:
-
Add files to the Download Cart using the download options icon above the data table.
-
Access the cart by clicking on the shopping cart icon in the top-right corner, then click Download as .Zip Packages.
For information, follow the User Guide #1 Guide.
For advanced users: Download data programmatically using Python, R, or the Synapse command-line client. Detailed instructions are available in the Synapse Docs.

6. Sending Data to CAVATICA
You can send data files directly to CAVATICA for analysis. Instead of adding files to the Download Cart, click the Send to CAVATICA button and follow the User Guide #4 Guide.
Tips for Successful Exploration
-
Use Exact Terms: The search bar works best with precise keywords. For more guidance see our article on Search Tips.
-
Visualizations: Explore charts to gain a high-level overview of available data.
-
Study Detail Pages: Dive into specific studies for methods, acknowledgments, and related data.
Overview of the Cohort Builder Subtab
The Cohort Builder helps users locate data in the ELITE Portal by defining groups of participants based on specific criteria. You can filter by individual attributes (e.g., age, sex, diagnosis) or data file properties (e.g., study, data type, assay, or file format). Once a cohort is defined, you can explore the data or perform further analysis.
Stay tuned for additional tutorials coming soon!